The Future of Mobility is Circular.

We help German SMEs switch their fleets to electric – and give every battery a second life.

4.2M
SME vehicles in Germany
87%
EV efficiency rate
75%
Battery capacity at 2nd life
STAGE 01
New Battery
Deployed in fleet EV
STAGE 02
Active Use
Charge · drive · cycle
STAGE 03
Health Telemetry
SoH tracked in real time
STAGE 04
Retirement
~75% capacity reached
STAGE 05
Second Life
Stationary storage
The battery journey. A new pack is deployed in a fleet EVcycles daily through active use under live state-of-health telemetryretires from the vehicle at ~75% capacityenters a productive second life in stationary storage – and its materials return to the supply chain. The loop never ends.
§ 01 · The Scientific Case

The Fundamental Energy Inefficiency.

A thermal camera reveals the real difference between a petrol and an electric car. What looks like a design choice is actually a law of physics – and the gap is visible in infrared.

Thermal comparison: conventional ICE vehicle radiating heat vs. electric vehicle remaining cool – the scientific case for the EV shift.
Illustrative thermal model · Left: Conventional ICE (up to 80% thermal loss) · Right: Electric drivetrain (thermally neutral body)
⟨ Conventional · ICE Vehicle ⟩

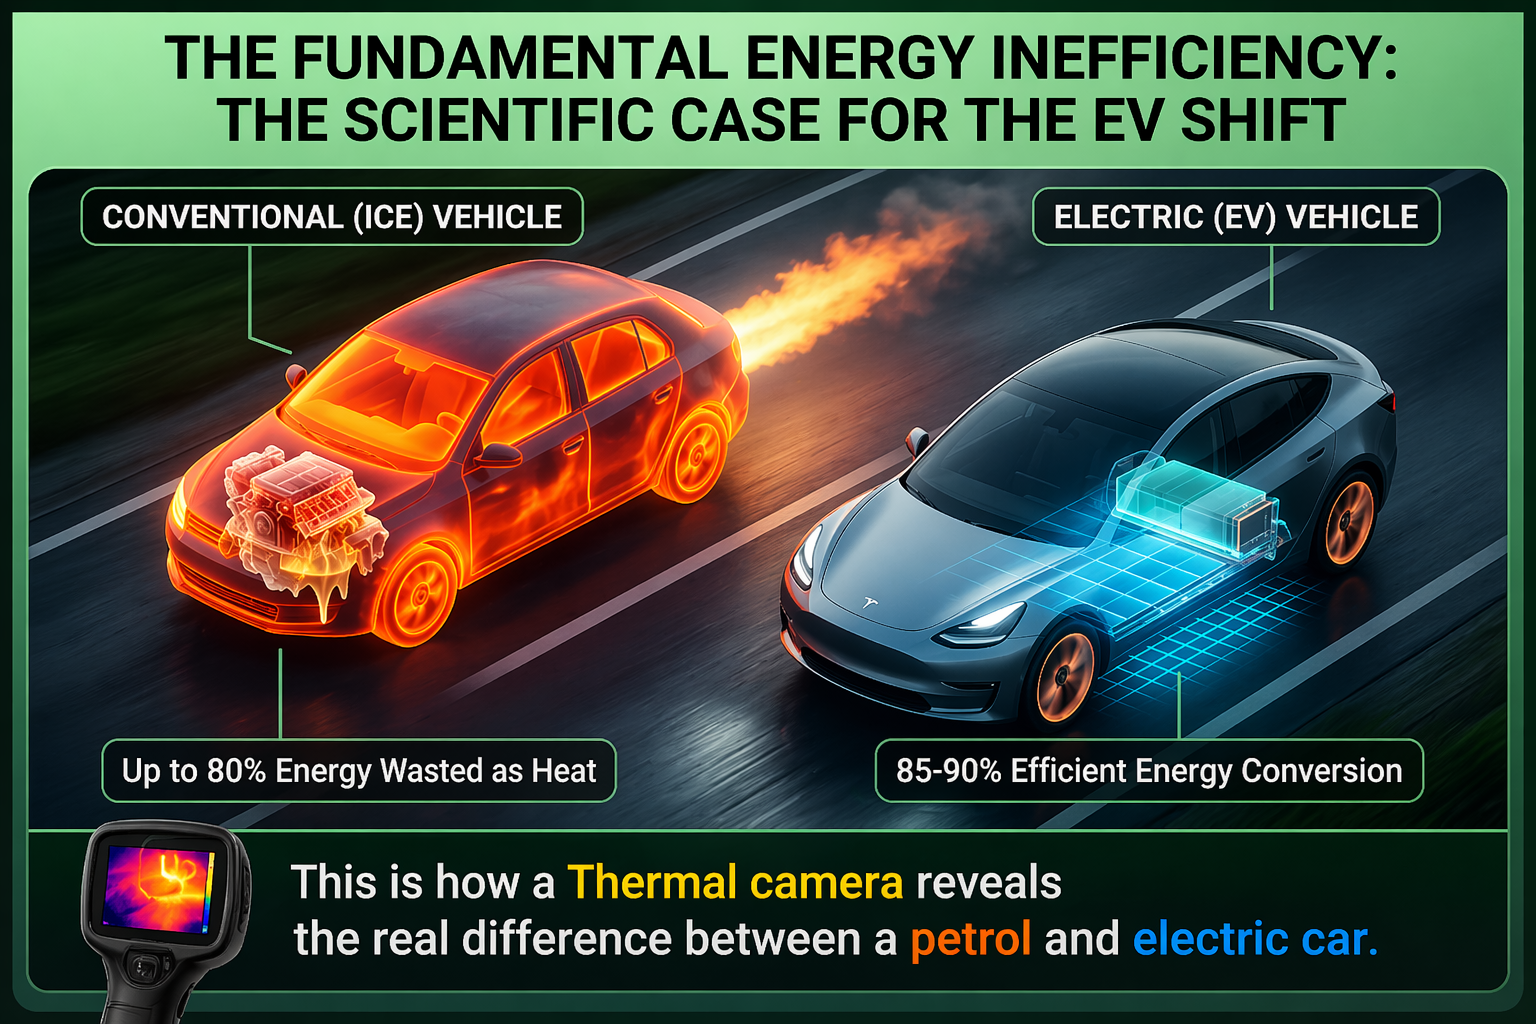
Energy Wasted as Heat

Up to 80%
lost as thermal waste

Combustion engines discharge the majority of their fuel energy as diffuse thermal waste – radiating across the engine block, manifold, exhaust, and drivetrain. Only a small fraction ever reaches the wheels as motion. This is not an engineering margin to optimize; it is the defining thermodynamic cost of the ICE architecture.

⟨ Electric · EV Vehicle ⟩

Efficient Energy Conversion

85 – 90%
converted to motion

Electric drivetrains convert stored energy directly into torque, with only minor, localized heat at the motor and wheel hubs. The vehicle body reads thermally neutral – cool blue under IR imaging – directly reducing urban heat islands and PM10 particulate load in dense delivery zones.

§ 02 · The Impact Engine

Quantify your transition. In real-time.

Enter your fleet parameters. Our calculator returns a transparent annualized projection – economic, environmental, and second-life battery yield – calibrated to German SME operating conditions.

Fleet Transition Calculator
Live model
Fleet Size
vehicles
Daily Range per Vehicle
km / day
Operating Days / Year
days / year
Primary Charge Source
Annualized Projection
CO₂ Saved
SDG 13
78t CO₂ / year
Second-Life Battery Potential
SDG 12
1.125kWh repurposable
TCO Savings
SDG 8 / 9
67.500annual vs. ICE
Thermal Waste Eliminated
SDG 11
1.630kWh/day, urban heat
§ 03 · Green-Charge

Find green charging stations near you.

Search by city or postal code – every station is scored against Germany's live carbon-free grid share via Electricity Maps API.

No search yet
Enter a city or postal code above to see all available charging stations, sorted by distance.
§ 04 · The Circular Lifecycle

Four stages. Zero waste.

Every battery we manage follows a defined circular path. Nothing is discarded – each stage feeds the next, by design.

AUDIT
STAGE 01
🔍
Fleet Audit
Diagnostic of existing ICE fleet, routes, charging viability, and SME budget constraints.
e.g. Hoffmann Logistics, Wismar – 14 diesel vans, 280km of daily routes. Our audit identified 9 vehicles ready for immediate EV transition, saving €31,000 in projected annual fuel costs.
DEPLOY
STAGE 02
Green-Charge Deployment
EV rollout synchronized with renewable APIs – wind & solar at point of use.
e.g. Hoffmann's 9 new EVs now charge overnight at Rostock harbour – automatically synced to Baltic offshore wind peaks, averaging 89% carbon-free energy per session.
MONITOR
STAGE 03
📊
Battery Health Monitoring
Continuous state-of-charge telemetry tracks degradation curves in real time.
e.g. after 3 years, Hoffmann's first VW ID.3 battery reaches 75% capacity therefore scheduling second-life handover before any performance impact.
REPURPOSE
STAGE 04
Second-Life Repurposing
At ~75% capacity, batteries exit the vehicle and begin a second productive life.
e.g. Hoffmann's retired battery pack is now a solar storage unit at Wismar Marina – powering harbour lights through the night. The loop never ends.
§ 05 · UN 2030 Alignment

Five SDGs. Operationally, not rhetorically.

Each commitment is tied to a measurable mechanism in our operating model. Hover any card to see how.

7
Clean Energy
Direct renewable sourcing via Green-Charge API – not offset credits.
SDG 7 · Clean Energy
Every charging session is traced to verified wind or solar input. We do not purchase offsets; we synchronize consumption with real production.
9
Industry & Innovation
AI-matched EV deployment tailored to German SME logistics.
SDG 9 · Industry & Innovation
Our deployment engine models real route data, infrastructure gaps, and SME budget ceilings – no generic recommendations reach the client.
11
Sustainable Cities
Measurable reduction in urban heat and PM10 particulates.
SDG 11 · Sustainable Cities
Thermographic evidence links ICE fleet withdrawal to cooler microclimates and measurable PM10 drops in dense delivery zones.
12
Responsible Consumption
Second-life marketplace routes batteries to storage, not landfill.
SDG 12 · Responsible Consumption
At ~75% capacity, batteries transition into stationary storage serving Wismar port infrastructure and local microgrids.
13
Climate Action
Transparent, auditable CO₂ reduction tied to live telemetry.
SDG 13 · Climate Action
Every tonne saved is traced to a specific vehicle-kilometer and charge event – fully auditable for ESG disclosure.

EV.com.de is free for every SME and driver. We sustain the platform through fleet advisory partnerships, green charging network integrations, and municipal white-label licensing – ensuring long-term independence and impact.